Interactive satellite workspace
Trace road alignments and project boundaries directly on OpenStreetMap, satellite imagery, STM topography or DEM hillshade — snap to stations every 500 m.
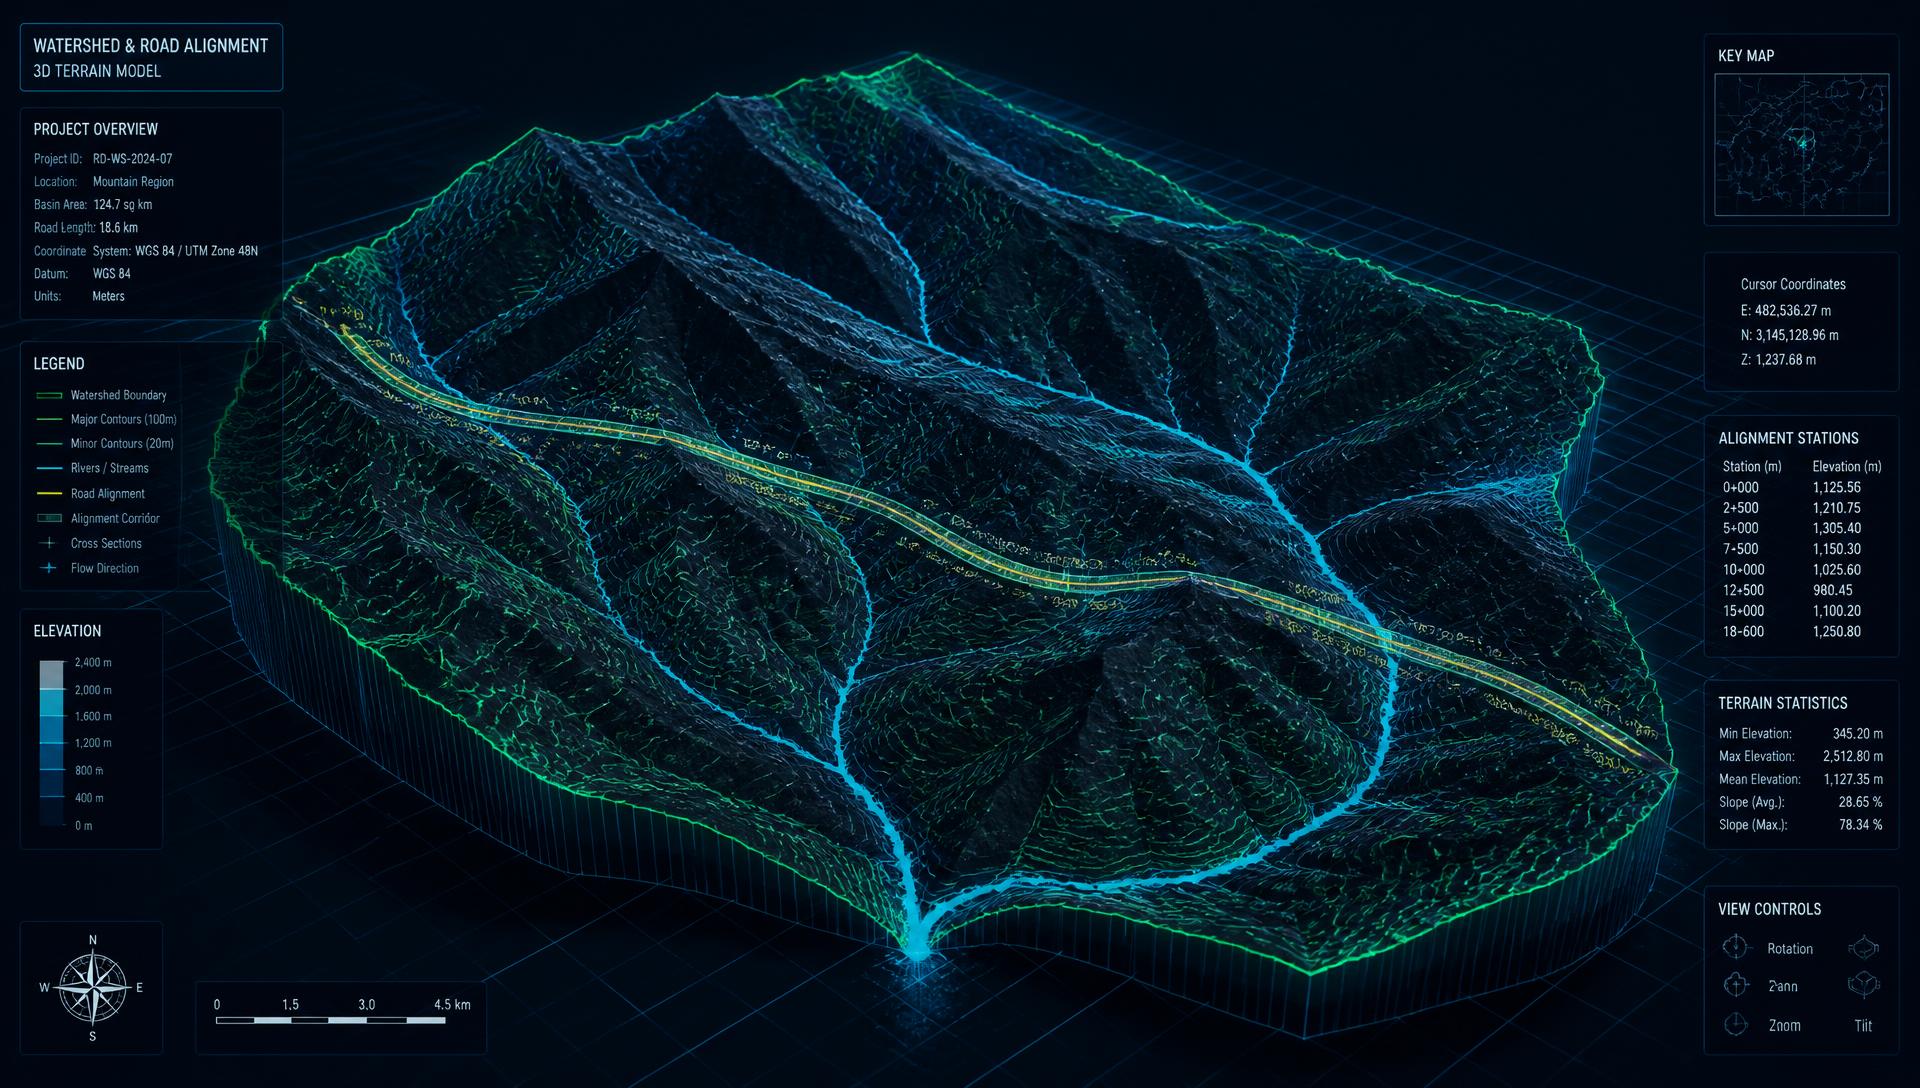
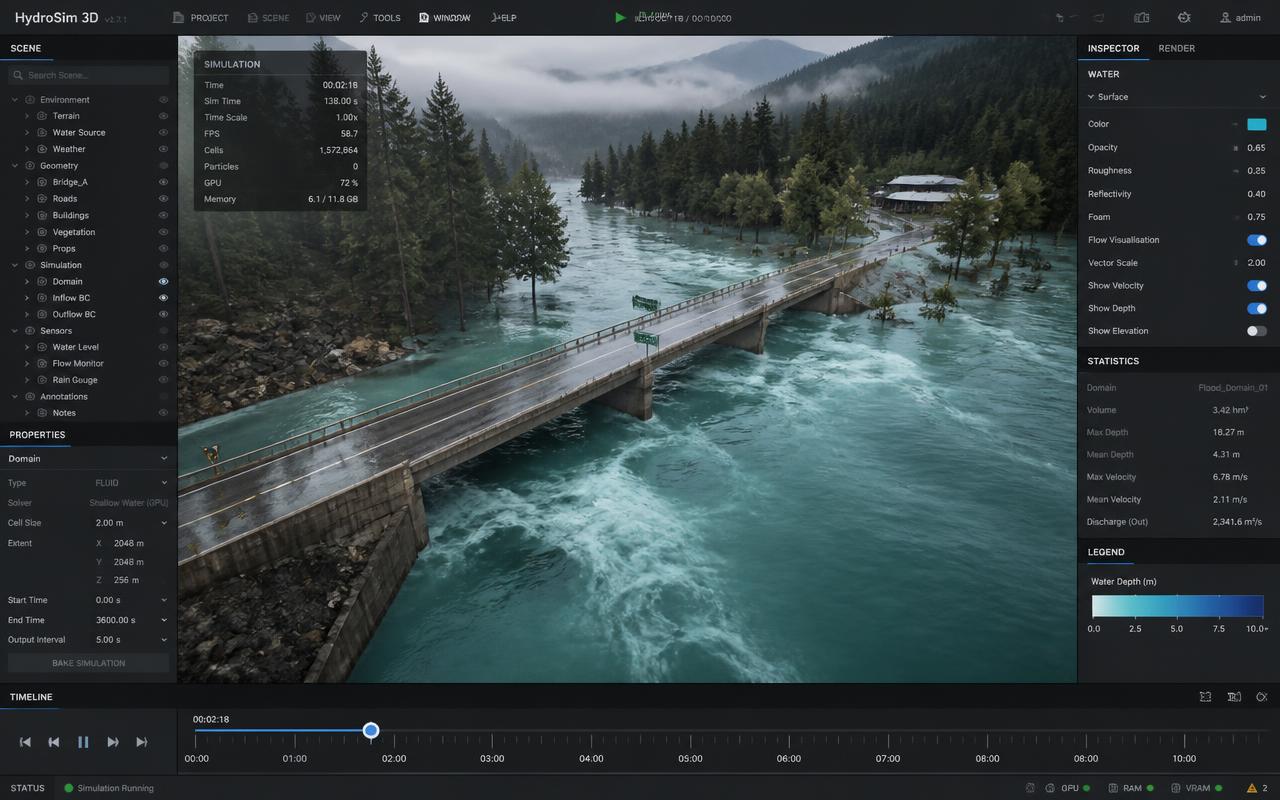
WAV turns satellite imagery, terrain models and hydrology into a living digital twin of your corridor. Trace an alignment, let the AI agent delineate and number every watershed, then run flood scenarios in a realtime 3D scene.
A live OpenStreetMap workspace with satellite, topographic (STM) and DEM hillshade basemaps. Sketch your route corridor and study area, then the AI agent delineates and numbers every contributing watershed.
4 watersheds detected and numbered along 22.4 km of alignment. 2 crossings flagged for a 100-year flood scenario review.
WS-03
Everything a road engineering team needs between the first satellite look and the final drainage report.
Trace road alignments and project boundaries directly on OpenStreetMap, satellite imagery, STM topography or DEM hillshade — snap to stations every 500 m.
The AI agent detects, delineates and numbers every contributing watershed crossing your corridor, no manual pour-point picking required.
Per-basin area (km²), mean slope (%), min/max elevation (m), relief, flow length and drainage density, computed straight from the DEM.
Run 2, 10, 25, 50 and 100-year return periods. Peak discharge, water depth at crossings and inundation extents per basin.
Culvert and bridge pre-sizing suggestions derived from the computed discharge and channel geometry along the alignment.
Each basin gets a low / moderate / high risk grade so design effort concentrates where the corridor is actually exposed.
One-click hydrology and drainage reports with tables, longitudinal profiles and map figures ready for the client submission.
Bring in shapefiles, GeoTIFF DEMs and GeoJSON. Ship results as KMZ, KML, DXF, GeoJSON or CSV.
Every delineation, DEM tile and flood run feeds a collaborative 3D stage. Scrub the timeline and watch the flood propagate through your crossings before a single cubic metre is excavated.
USD scene assembly
Terrain, corridor, structures and hydro mesh merged into one live stage.
Physics solver
GPU shallow-water solver streams depth and velocity fields per timestep.
Realtime viewport
RTX-grade rendering with review sessions shared across the design team.
Telemetry loop
Sensor and rain-gauge feeds replayed against the twin for calibration.
A built-in multi-language editor wired to the project graph. Compute infrastructure quantities, calibrate hydrology models and generate reports — Python, C, C++, Matlab and Java, all against the same digital twin.
from wav import Project, Rational

prj = Project.open("RD-2024-07")
basins = prj.agent.delineate(dem="srtm30", corridor=prj.alignment)

for b in basins:
    q100 = Rational(area=b.area_km2, slope=b.slope_pct, c=0.45).peak(period=100)
    print(f"WS-{b.id:02d} {b.name}: {b.area_km2} km2 -> Q100 = {q100:.1f} m3/s")

prj.report("hydrology").to_pdf("drainage_report.pdf")
prj.export(["kmz", "kml", "dxf"], folder="deliverables/")
Console
> agent.delineate 4 basins, 22.4 km corridor WS-01 Nabitenga Upper: 18.42 km2 -> Q100 = 46.8 m3/s WS-02 Koubri Tributary: 11.07 km2 -> Q100 = 27.4 m3/s WS-03 Massili Crossing: 24.93 km2 -> Q100 = 61.2 m3/s WS-04 Sambin East: 7.85 km2 -> Q100 = 19.1 m3/s✓ drainage_report.pdf written ✓ deliverables/ kmz · kml · dxf
Import shapefiles, GeoTIFF DEMs and GeoJSON. Export the twin to KMZ, KML and DXF in one pass — coordinate system, layer naming and styling preserved.
Google Earth bundle
Compressed package with basin polygons, alignment, station markers and styled flood extents.
Open geospatial
Plain KML layers per watershed, ready for Google Earth, QGIS or client review.
CAD handoff
Georeferenced polylines, contours and structure blocks on named layers for AutoCAD or Civil 3D.
Web & API
Basin geometry plus all computed attributes for your own dashboards and pipelines.
Quantities
Area, slope, elevations, discharge and structure sizing tables per basin and per station.
Deliverable
Formatted hydrology and drainage report with map figures, profiles and assumptions.
EPSG-aware. Pick WGS 84 or any UTM zone at export time — WAV reprojects geometry and elevations for you.
No installer, no licence dongle. Your projects, basins, scenarios and deliverables live in a single workspace your whole team can open.
The first project is free — no card required.
By continuing you agree to the WAV terms of service and data policy of KAADE CONSTRUCTION.
Active projects
3
Basins delineated
21
Compute this month
4.2 h
$0first project
One full project to prove the workflow on your own corridor.
$79per user / month
For design teams running drainage studies continuously.
Customannual agreement
For infrastructure programmes and public works agencies.